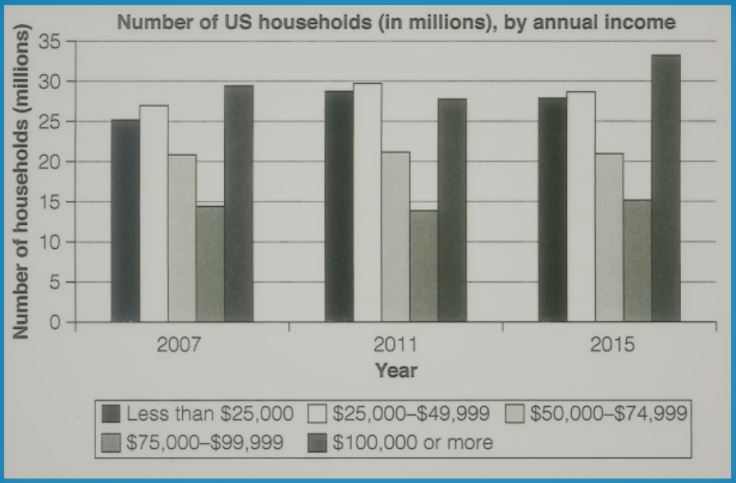
The bar chart details the total number of households in the United States categorized by average annual income from the year 2007 to 2015.
The bar chart details the total number of households in the United States categorized by average annual income from the year 2007 to 2015.


Leave feedback about this