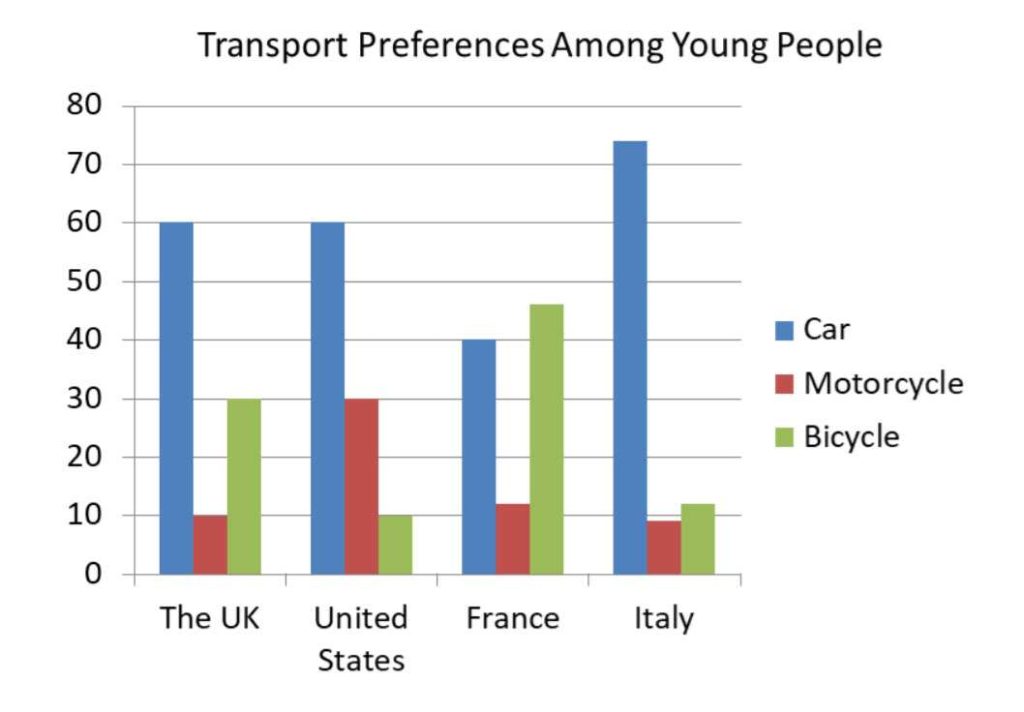
Bar chart-Transport Preferences Among Young People
The bar chart below shows transport preferences among young people in four countries in a single year.
Summarise the information by selecting and reporting the main features, and make comparisons where relevant.

