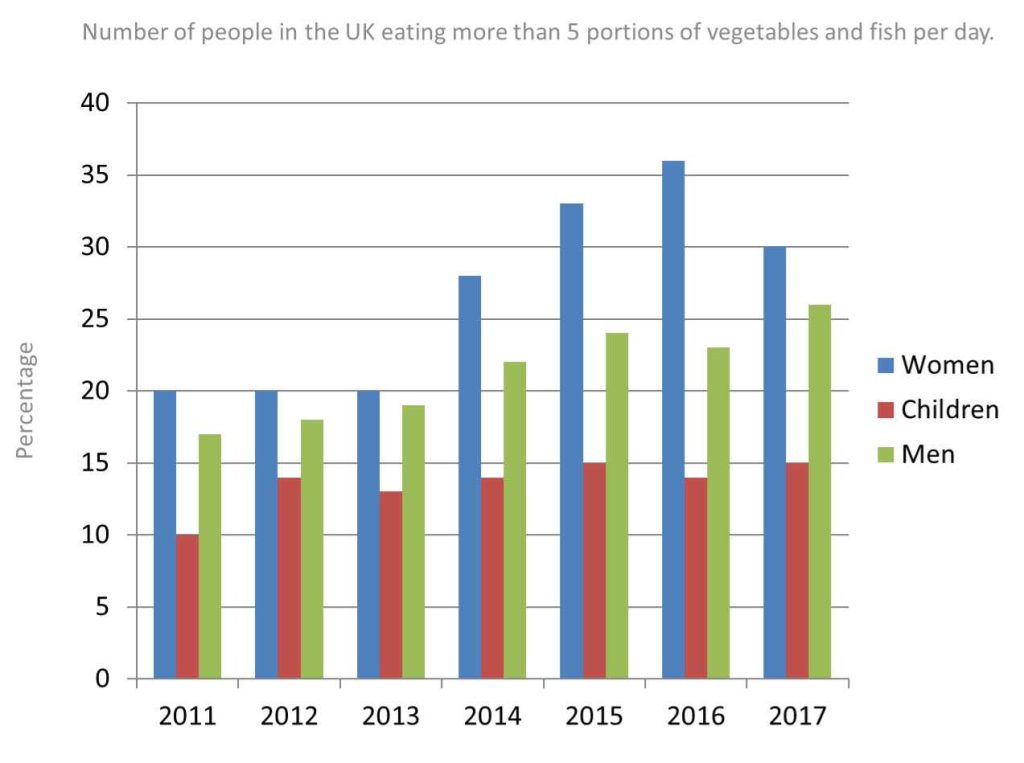
Bar chart-Consumption of Vegetables and Fish
The bar chart illustrates the number of people in the UK eating more than 5 portions of vegetables and fish per day.
Summarise the information by selecting and reporting the main features, and make comparisons where relevant.